Quality & Acceptance
Chapter 10 — Quality differentiation, defect identification, control practices, and acceptance standards
Quality assurance for boundary security deployments requires both visual field inspection and systematic testing. The gap between a professional installation and a substandard one is often not visible in normal operation — it only becomes apparent during incidents, failovers, or maintenance windows when the consequences are most severe. This chapter provides the tools to identify quality issues before they become operational failures.
10.1 Quality Differentiation — Good vs. Bad Installation
The comparison photograph below illustrates the eight most critical visual quality indicators that distinguish a professional boundary security installation from a substandard one. Each indicator on the left (good) represents a deliberate design decision that reduces mean time to repair (MTTR) and prevents failures; each indicator on the right (bad) represents a common shortcut that creates hidden risk.
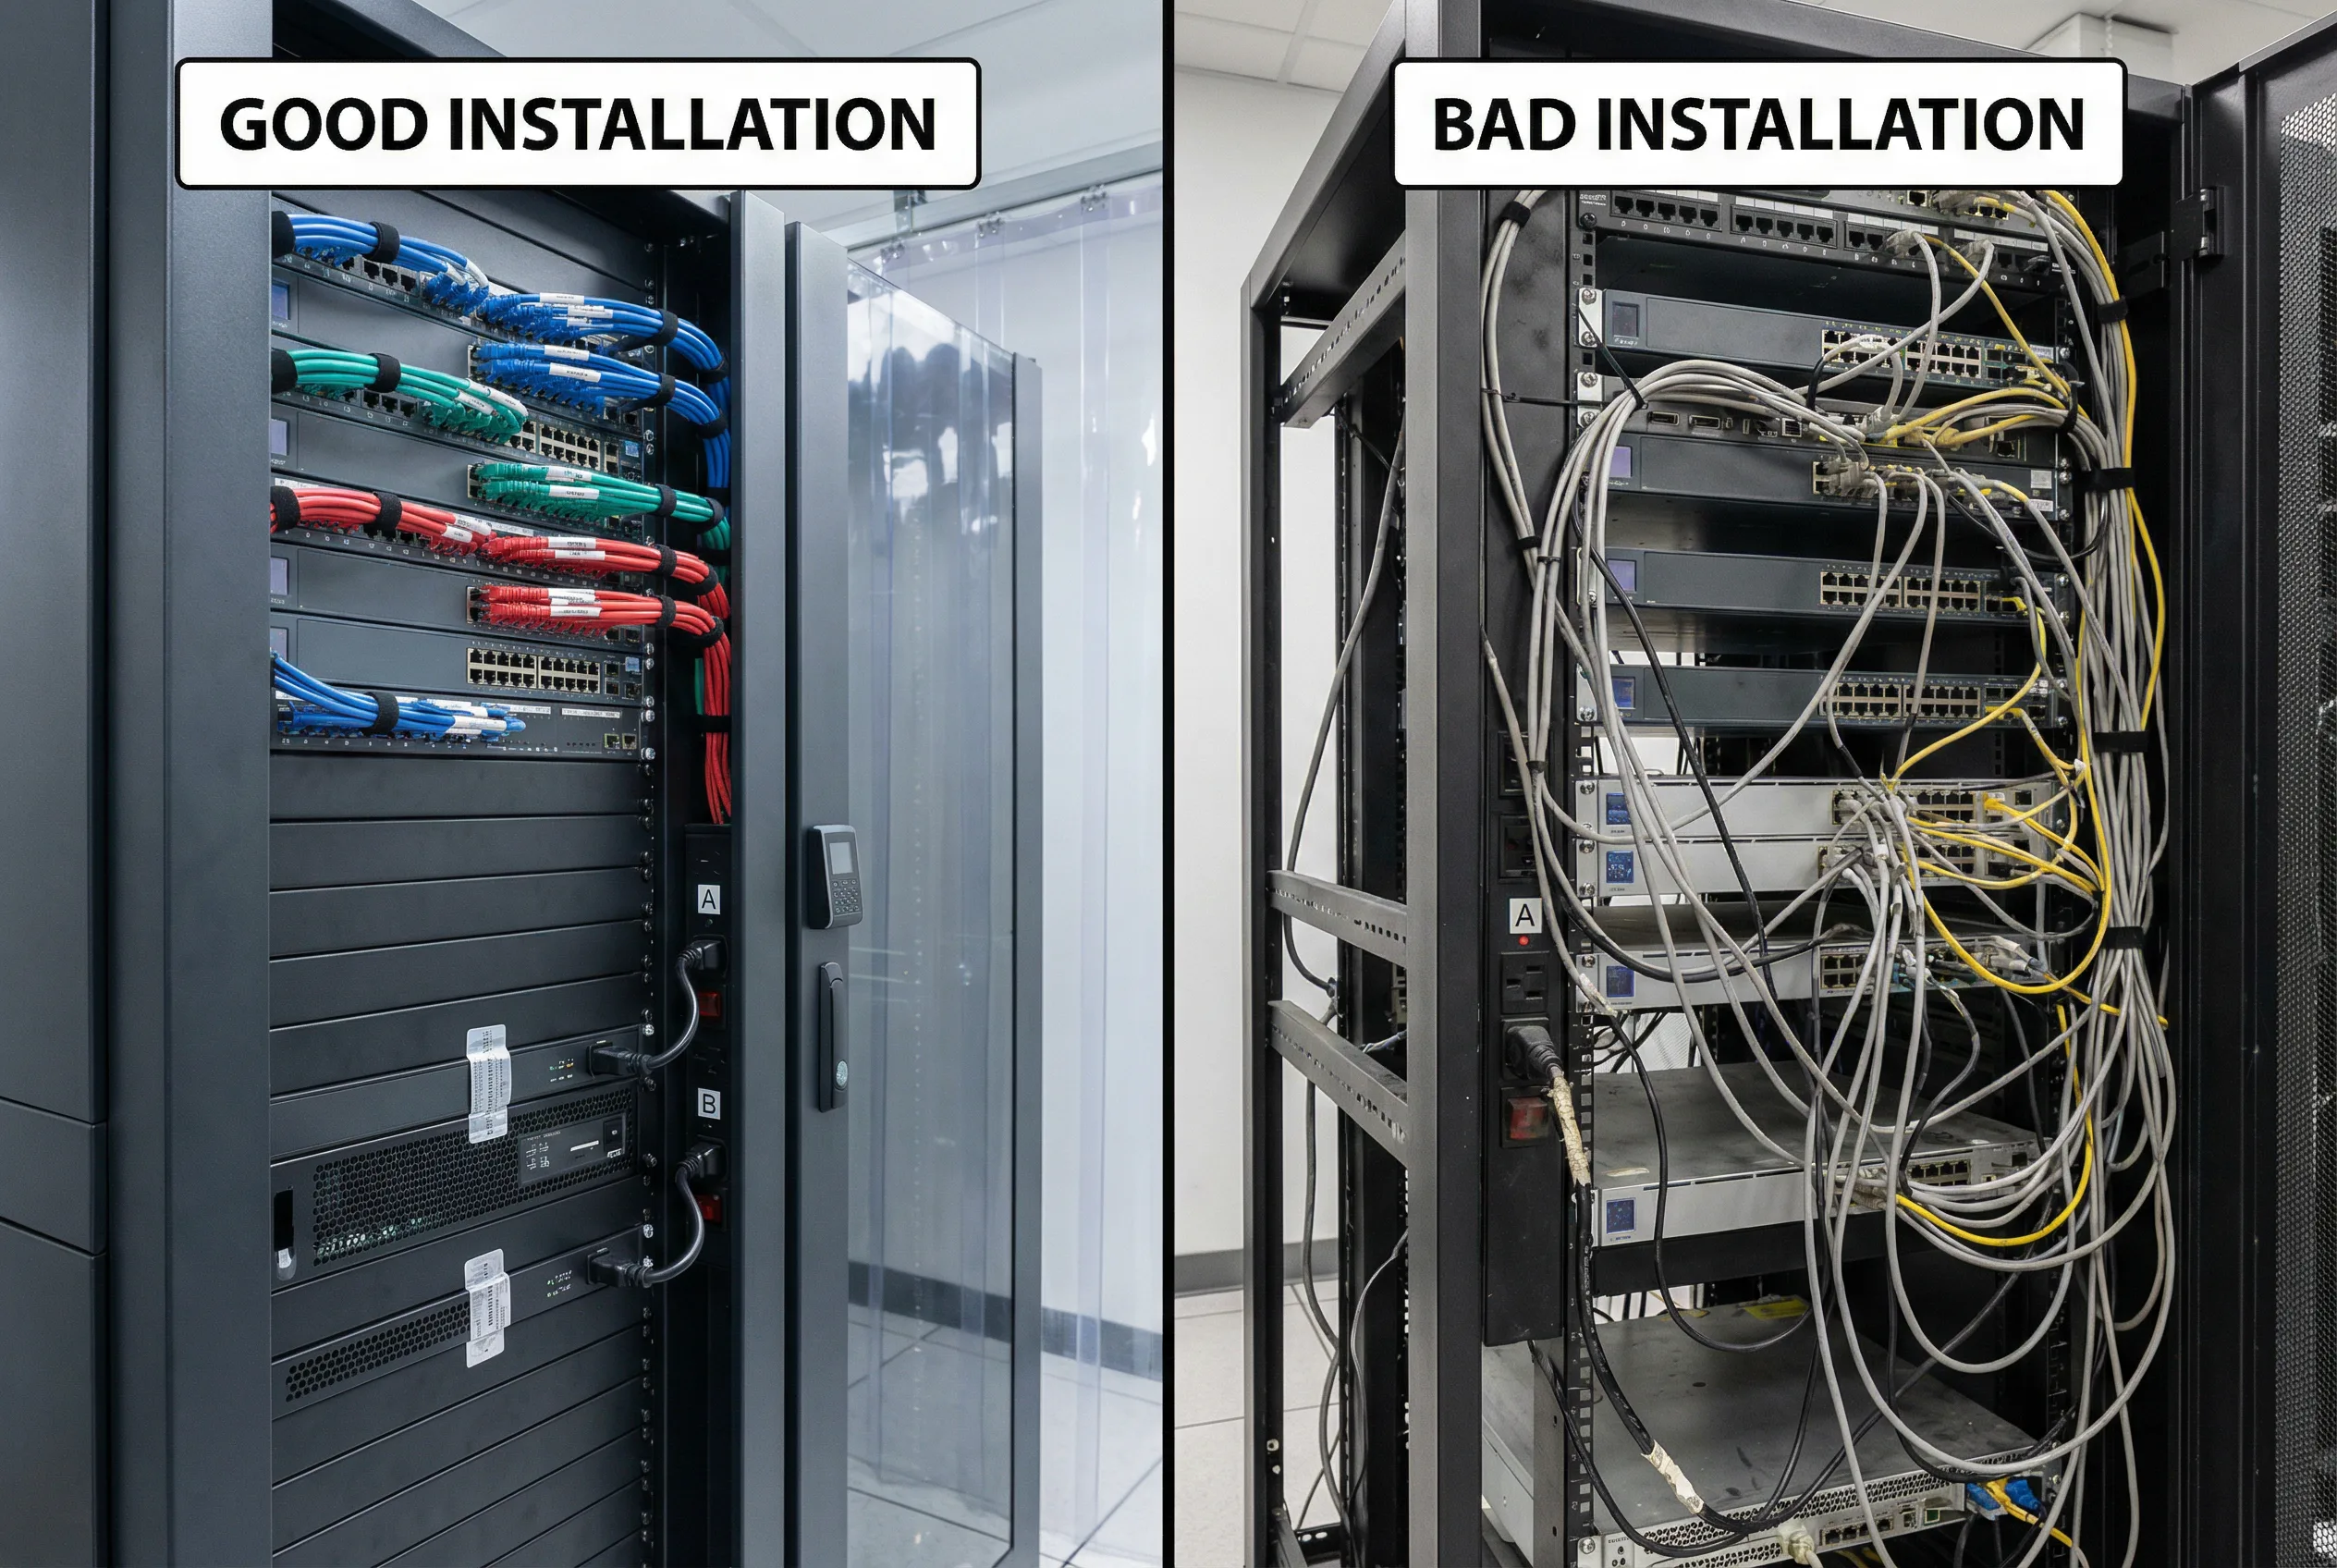
Figure 10.1: Quality Comparison — Good Installation (left): labeled cables, dual A/B power feeds, blanking panels, tamper seals, locked rack, OOB management isolated, Velcro cable management, clean airflow. Bad Installation (right): tangled cables, single power feed, unlabeled ports, open unused ports, missing blanking panels, management exposed on production VLAN
Field Identification Checklist (12 Quality Indicators)
| # | Quality Indicator | Good Practice | Bad Practice | Risk if Bad |
|---|---|---|---|---|
| 1 | Dual Power Feeds | Both PSUs connected to separate A/B PDUs and breakers | Single power feed or both PSUs on same PDU | Single breaker trip causes complete device outage |
| 2 | HA Link Separation | Dedicated HA cables on dedicated ports, separate from data | HA link shared with data interface or same switch | Data congestion causes HA instability and false failovers |
| 3 | Cable Labels | Heat-shrink labels at both ends matching CMDB documentation | Unlabeled cables or handwritten labels that fade | Incorrect cable removal during incidents; extended MTTR |
| 4 | Unused Port Security | All unused ports disabled in config and blocked with port blockers | Open unused ports, no port blockers, no config disable | Unauthorized device connection; USB attack vectors |
| 5 | Zone Separation | DMZ and internal zones clearly separated by VRF/VLAN with verified tags | Mixed zone cables, no VLAN verification, shared interfaces | Zone bypass; lateral movement between security domains |
| 6 | Log Heartbeat Evidence | SIEM shows heartbeat events from every boundary device | Missing log sources; gaps in SIEM coverage | Undetected attacks; audit failures; compliance violations |
| 7 | Time Sync Verification | All devices within 1 second of NTP reference; drift monitored | Clock drift; no NTP; devices using local clock | Log correlation failures; missed attack sequences |
| 8 | Config Backup Evidence | Automated backups with restore test evidence present | No backup; manual backup only; no restore test | Unrecoverable config loss after hardware failure |
| 9 | WAF Origin Protection | WAF/API gateway sits in front of all public endpoints; no bypass path | Direct origin access possible; WAF bypass route exists | Direct exploitation of origin servers bypassing WAF |
| 10 | DDoS Diversion Readiness | BGP diversion runbook verified; scrubbing service tested | No diversion plan; scrubbing service not contracted or tested | Extended outage during volumetric DDoS attack |
| 11 | Blanking Panels | All unused rack units filled with blanking panels | Empty rack units creating airflow bypass | Hot air recirculation; device overheating and throttling |
| 12 | Tamper Seals | Serialized tamper seals on all chassis screws; log maintained | No tamper seals; undetected physical access to internals | Undetected hardware implants or component replacement |
10.2 Defects & Risk Chains
The defect table below documents the six most common types of boundary security deployment defects, their symptoms, root causes, risk chains, detection methods, and remediation actions. Understanding the full risk chain — from defect to consequence — is essential for prioritizing remediation efforts and designing preventive controls.
| Defect Type | Symptom | Root Cause | Risk Chain | Detection Method | Remediation |
|---|---|---|---|---|---|
| Rule Sprawl | Excessive allow rules; policy too large to audit | No rule lifecycle management; no expiry dates or owners | Overly permissive policy → exposure → breach | Quarterly rule audit; unused rule report | Enforce expiry dates + ownership; remove unused rules |
| Asymmetric Routing | Random packet drops; intermittent connection failures | ECMP or PBR misconfiguration; stateful FW with asymmetric paths | State table miss → session drop → bypass or outage | Flow analysis; traceroute path verification | Enforce routing symmetry; verify with controlled tests |
| Log Coverage Gaps | Missing log sources in SIEM; incomplete audit trail | EPS capacity limits; misconfigured log forwarding; storage full | Detection blind spot → missed attack → audit failure | Daily log source completeness check; SIEM SLO monitoring | Scale EPS capacity; fix forwarding config; expand storage |
| HA Instability | Frequent failovers; split-brain events; inconsistent HA state | Untested HA configuration; shared HA and data links; firmware mismatch | Unexpected failover → traffic disruption → extended downtime | HA event log monitoring; scheduled failover drills | Dedicated HA links; firmware parity; tune heartbeat thresholds |
| Cloud Public Ports | Security group allows 0.0.0.0/0 on admin or sensitive ports | Configuration drift; IaC not enforced; manual changes | Exposed admin interface → credential attack → compromise | CSPM continuous scanning; daily posture report | Auto-close via CSPM; enforce IaC; restrict to allowlist |
| DNS Bypass | Malware resolves external C2 via non-approved DNS | No egress DNS control; outbound port 53 not blocked | DNS tunneling → C2 communication → data exfiltration | DNS query log analysis; anomaly detection on DNS volume | Block outbound 53/853 except approved resolvers; enable DNS security |
10.3 Quality Control Practices
The following twelve quality control practices form the operational foundation for maintaining boundary security system integrity throughout the deployment lifecycle, from initial installation through ongoing operations.
- Incoming inspection: Verify model and serial numbers against purchase order; confirm firmware baseline matches approved version; test optics compatibility with DOM diagnostics before installation.
- Configuration linting: Automated policy checks that forbid any-any rules, require descriptions and owners on all rules, and enforce expiry dates on temporary rules.
- Staged deployment: Deploy to canary environment first; validate all acceptance tests before production rollout; maintain tested rollback procedure.
- Log onboarding checklist: Verify every boundary device appears in SIEM within 24 hours of deployment; daily log source health check with automated alerting on gaps.
- Quarterly failover drills: Scheduled HA failover tests with measured RTO; update documentation with actual results; identify and remediate any deviations from target.
- Certificate lifecycle monitoring: Alert on certificates expiring within 30 days; rehearse renewal procedure quarterly; verify TLS inspection remains functional after renewal.
- Periodic internet exposure scans: Weekly scan of all public-facing assets; compare against authorized asset inventory; investigate any unexpected exposure within 24 hours.
- Change review board: All high-risk rule changes (internet-facing, any-any, admin access) require peer review and documented approval before implementation.
- Backup encryption and restore test: Quarterly restore test from encrypted backup to isolated environment; verify configuration integrity with hash comparison.
- Post-change validation tests: Automated connectivity and security assertion tests run after every change; block deployment if tests fail; require manual sign-off for exceptions.
- Vendor access review: Monthly review of all vendor and third-party access; revoke unused access immediately; enforce JIT access with session recording.
- Capacity trend review: Monthly review of throughput, session, and storage utilization trends; initiate procurement when any metric exceeds 70% of capacity.
10.4 Acceptance Standards & Test Items
The acceptance test matrix below defines the minimum test requirements across eight domains. All tests must pass before a boundary security deployment is accepted into production. Evidence must be retained for a minimum of two years for audit purposes.
| Domain | Test Item | Method | Pass Criteria | Evidence Required |
|---|---|---|---|---|
| Functional | Policy enforcement: allow/deny/NAT/QoS | Controlled traffic tests from each zone | Correct allow/deny for all test cases; zero false positives | Test report with traffic captures |
| Performance | Throughput and latency under load | Load generation tool at 80% of rated capacity | Throughput within 5% of SLA; latency within SLA | Performance graphs and log exports |
| Stability | 72-hour soak test under production-like load | Continuous monitoring during soak period | No critical alarms; no unexpected restarts; memory stable | NMS export covering full 72-hour period |
| Reliability | HA failover drill | Controlled failover with traffic running | Failover completes within target RTO; traffic resumes | Video recording + HA event log + traffic capture |
| Security | WAF OWASP Top 10 coverage | Automated scan against WAF-protected endpoint | All critical and high vectors blocked; false positive rate < 1% | Scan report with blocked/passed breakdown |
| Electrical | Power failure and UPS transfer test | Simulate A-feed failure; verify UPS transfer | No device reboot; transfer time < 10ms; UPS runtime verified | UPS transfer log; device uptime verification |
| Integration | SIEM log ingestion from all boundary devices | Verify log source list in SIEM against device inventory | ≥ 95% of expected log sources visible; EPS within expected range | SIEM source dashboard screenshot; EPS report |
| Automation | SOAR playbook execution on simulated alert | Inject test alert; verify automated response actions | Correct automated actions executed; ticket created; evidence logged | SOAR execution log + ITSM ticket + audit trail |