Architecture Design
Chapter 4 — Typical system topology, core indicators, device connections, and business logic
4.1 Typical System Introduction
The typical enterprise boundary security topology is organized around a redundant enforcement core that connects upstream ISP circuits to downstream internal zones through a series of controlled inspection points. The topology is designed to eliminate single points of failure at every layer, from ISP connectivity through to the management plane. All traffic flows are logged and forwarded to the central SIEM, and NDR sensors provide passive detection at three key vantage points: internet-inside, DMZ, and east-west core.
The topology distinguishes three major deployment domains: the internet-facing perimeter (ISPs, edge routers, NGFW, DMZ), the cloud connectivity layer (dual tunnels or direct connects to cloud transit hub and centralized cloud firewall endpoints), and the partner connectivity layer (dedicated partner VRF with separate gateway). A separate out-of-band management network connects to all devices and is the only permitted path for administrative access. All logs flow from device collectors to the SIEM, and SOAR integrates with the IdP and ITSM ticketing system for automated response with human approval gates.
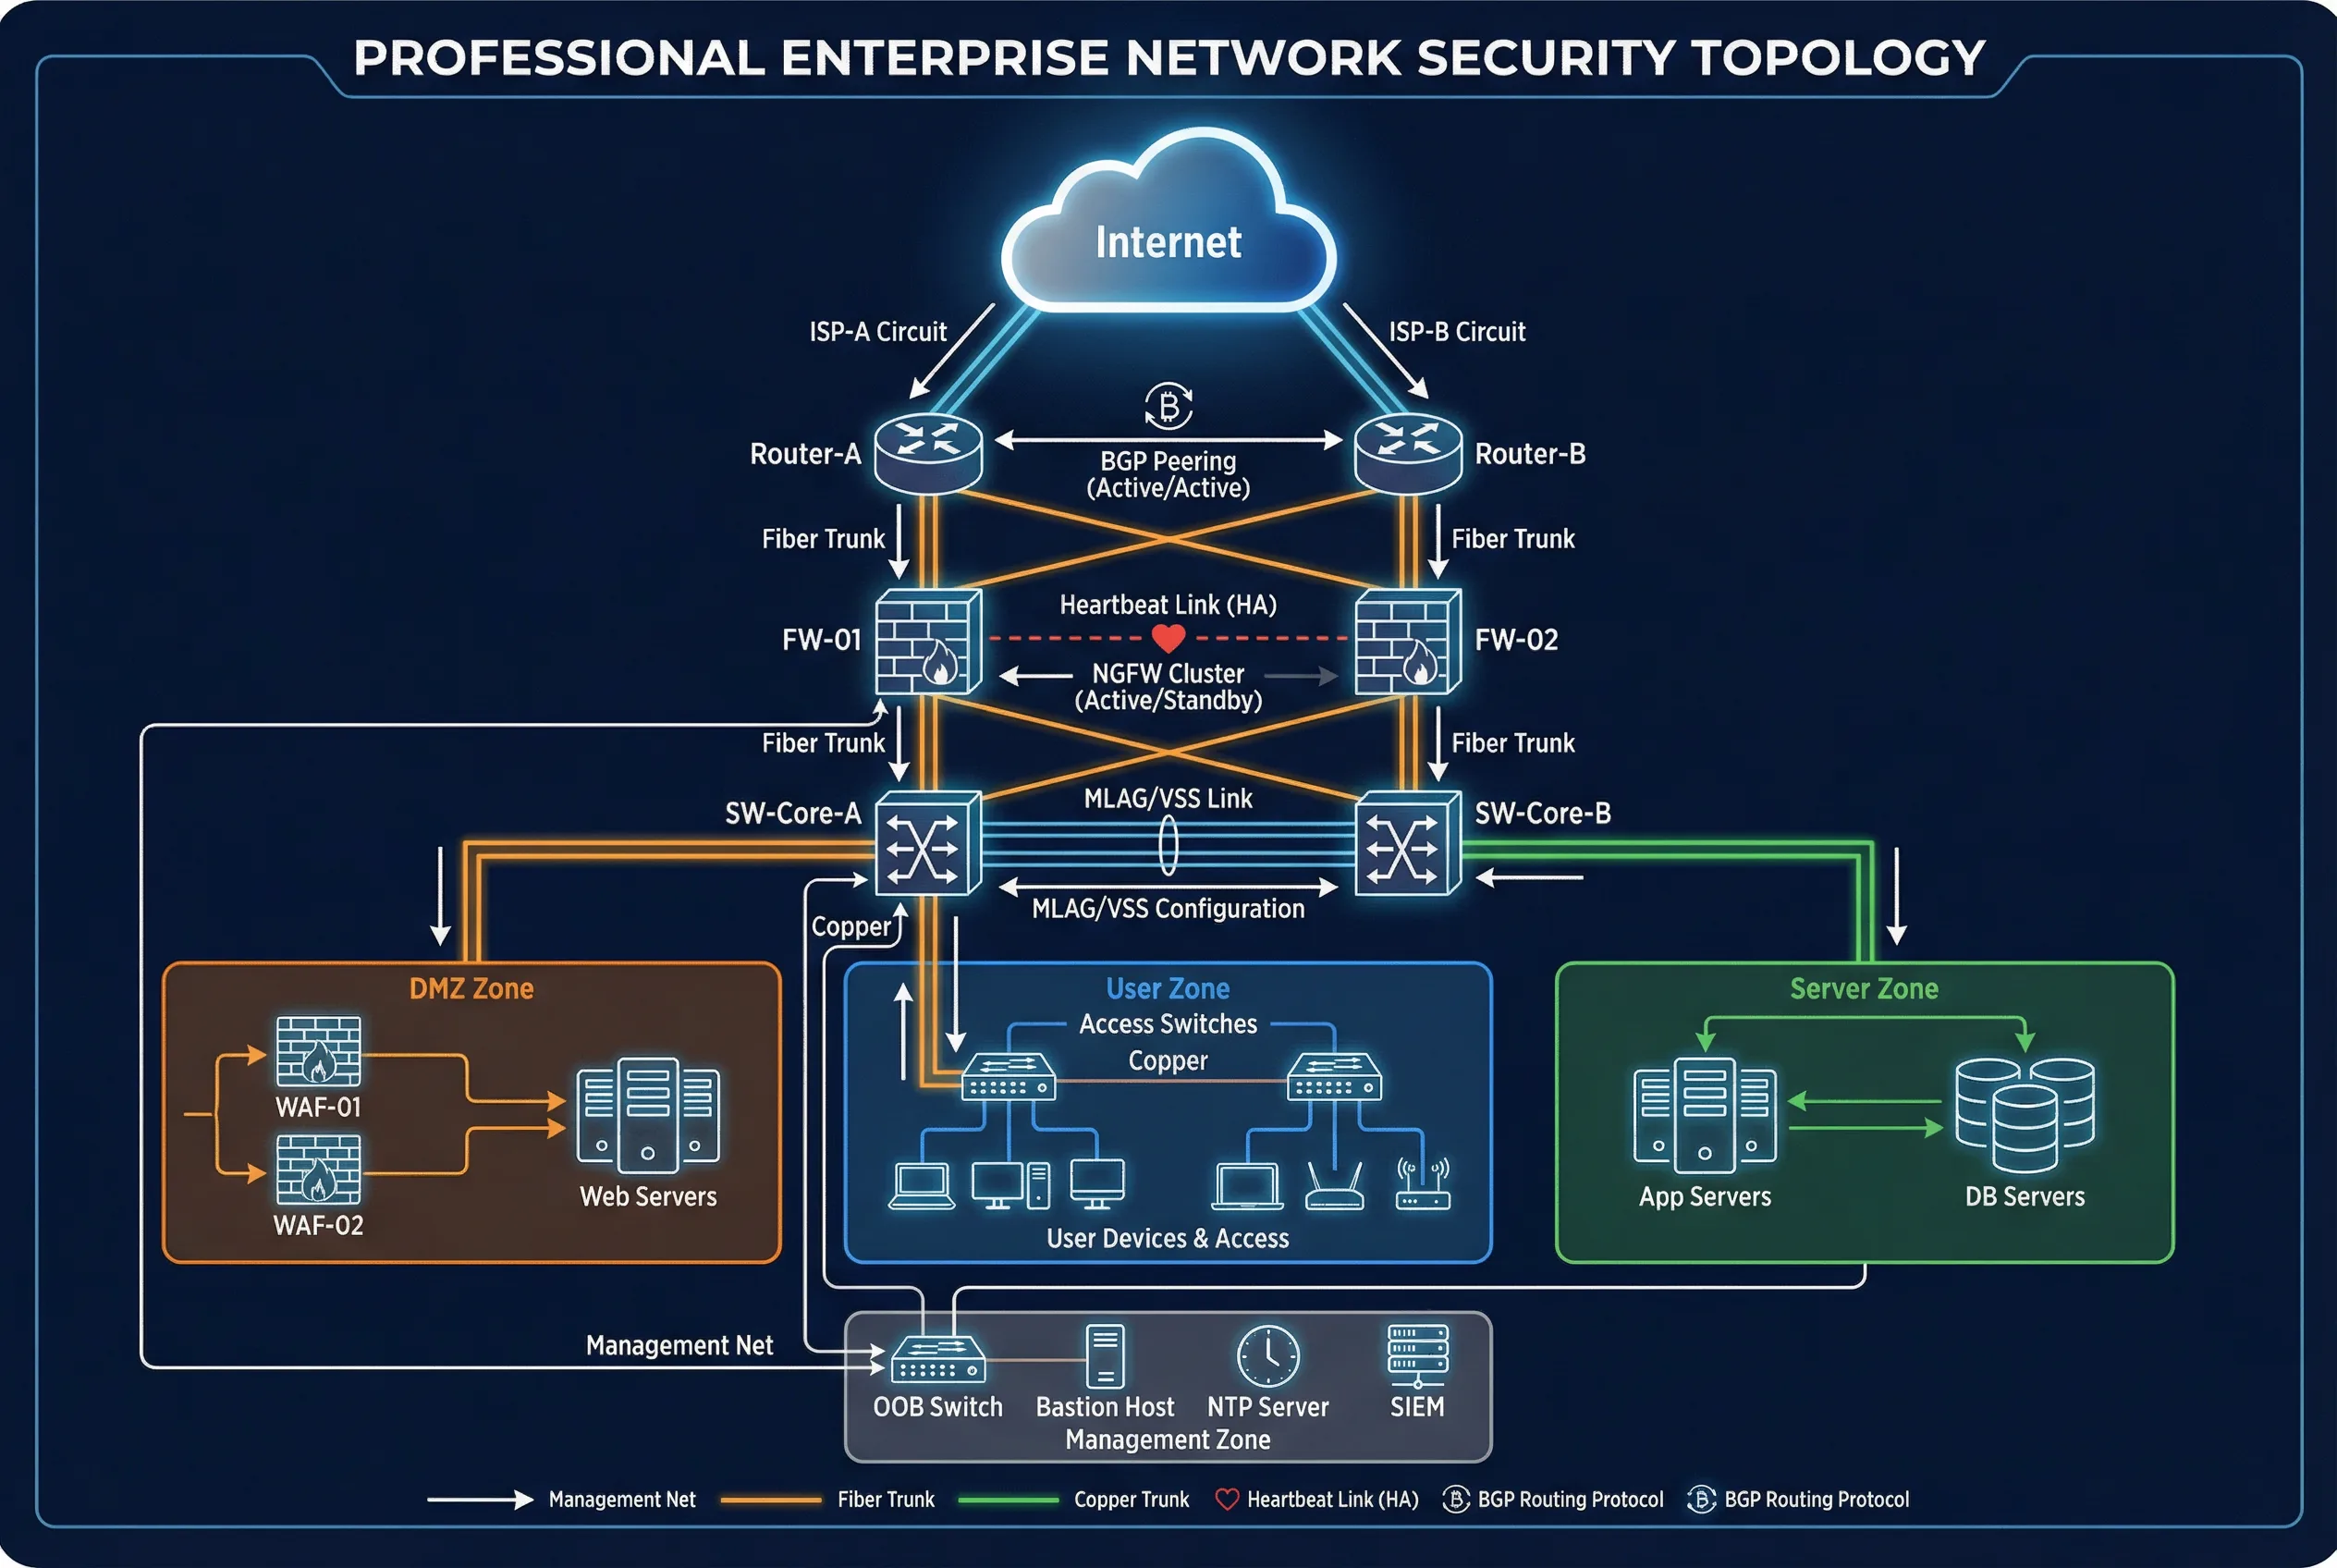
Figure 4.1: Typical Enterprise Boundary Security Topology — Dual ISP, dual edge routers, NGFW HA cluster, DMZ zone, user zone, server zone, and management zone with full redundancy
Node Roles and Responsibilities
| Node | Primary Role | Redundancy Model | Key Interfaces |
|---|---|---|---|
| Edge Routers (A/B) | Routing control, DDoS diversion signaling, route filtering | Active/Active with ECMP | ISP uplinks, NGFW downlinks, OOB management |
| NGFW (FW-01/FW-02) | Policy enforcement, NAT, IPS, segmentation gateway | Active/Standby with state sync | Router uplinks, core switch downlinks, DMZ, HA links, OOB |
| WAF/API Gateway | Application-layer security and rate limiting | Active/Active pair | DMZ switch uplinks, backend app VLAN |
| Core Switches (A/B) | Internal zone switching, VLAN/VRF enforcement | MLAG/VSS pair | NGFW downlinks, access switches, server zone |
| NDR/IDS Sensors | Passive detection and visibility | N+1 sensor coverage | TAP aggregation or SPAN ports at 3 vantage points |
| SIEM/SOAR | Correlation and automated response with guardrails | Clustered/HA deployment | Log collectors, IdP, ITSM, enforcement devices |
| OOB Management | Out-of-band admin access to all devices | Dedicated network, no production traffic | Console servers, bastion host, NTP, PKI |
4.2 Core Functions and Indicators
The following table defines the twelve core performance and security indicators for the boundary security system. Each indicator includes its rationale, implementation path, and acceptance method. These indicators form the basis for the acceptance test plan described in Chapter 10 and should be baselined during initial deployment and monitored continuously during operations.
| Indicator | Why It Matters | Implementation Path | Acceptance Method |
|---|---|---|---|
| Zone Isolation Effectiveness | Prevents lateral movement between trust zones | VRF/VPC + default deny inter-zone rules | Path scan + rule audit |
| Policy Hit Rate | Detects unused rules that create risk | Logging + analytics on rule counters | Monthly report with zero-hit rule review |
| TLS Inspection Coverage | Reduces blind spots in encrypted traffic | Selective decrypt policy with privacy review | Coverage report + privacy/legal sign-off |
| WAF Block Efficacy | Stops web exploits at the application layer | Positive security model + continuous tuning | OWASP test results + false positive rate |
| DDoS Mitigation Time | Maintains availability under volumetric attacks | Upstream scrubbing with BGP diversion | Drill with measured mitigation time |
| HA Failover Time | Ensures continuity during device failures | State sync + health check tuning | Quarterly failover test with RTO measurement |
| CPS Headroom | Provides resilience during traffic spikes | Sizing at 2x peak CPS + tuning | Load testing with synthetic traffic |
| Session Table Headroom | Prevents session drops during peak usage | Capacity planning at 2x peak concurrent sessions | Stress tests with session monitoring |
| Log Completeness | Ensures audit evidence and detection coverage | Source onboarding checklist + EPS budgeting | Daily SLO checks: expected vs. received sources |
| Time Sync Drift | Enables accurate log correlation across devices | Authenticated NTP hierarchy with monitoring | Drift report: all devices within 1 second |
| Configuration Drift | Prevents unauthorized or accidental changes | Config-as-code with automated drift detection | Drift detection alerts + remediation SLA |
| Change Success Rate | Measures stability of change management process | Pre-check automation + staged rollout + rollback | Change KPIs: success rate, rollback rate, MTTR |
4.3 Device Connection Diagram
The physical cabling map defines the exact interface connections between all boundary devices, including redundancy cross-connections, HA dedicated links, LACP/MLAG uplinks, and power distribution. The diagram below shows the dual-rack deployment with color-coded cables for each connection type. Correct physical cabling is essential for achieving the redundancy guarantees specified in the design — any deviation from the cross-connect pattern can create hidden single points of failure.
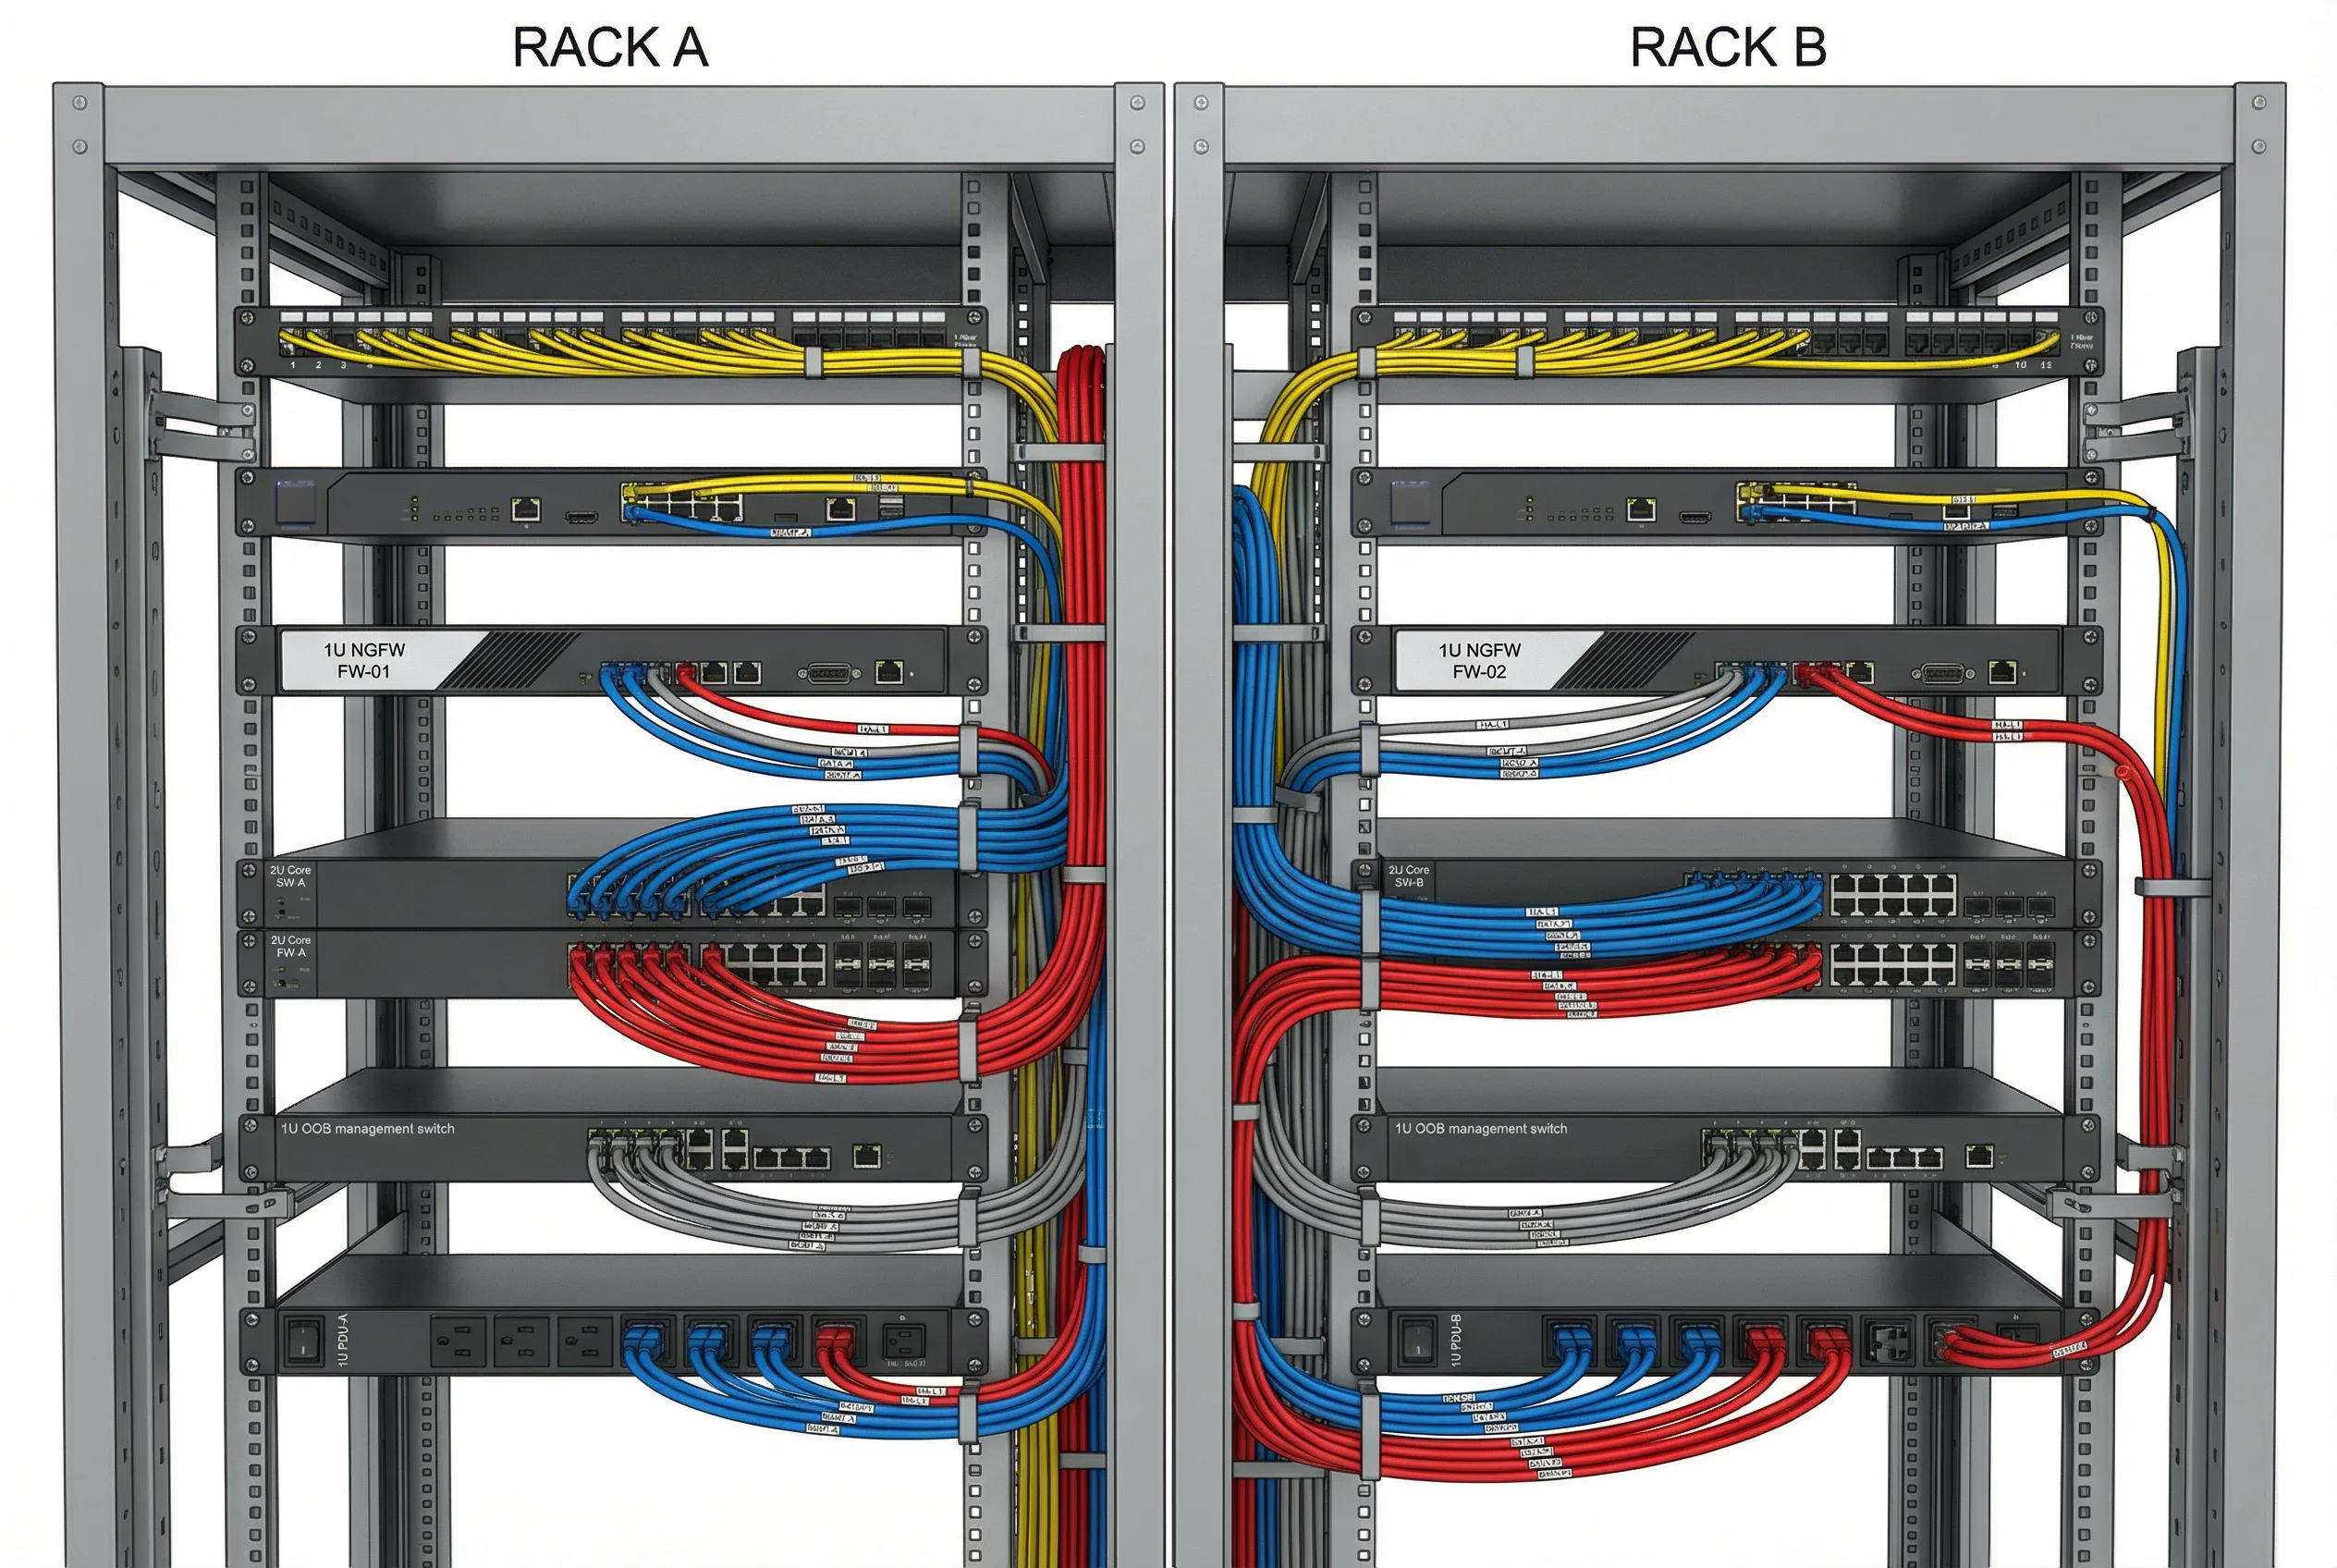
Figure 4.2: Physical Cabling Map — Dual rack deployment with color-coded cables: yellow (ISP uplinks), blue (data plane), red (HA heartbeat), gray (management); all connections labeled with port numbers
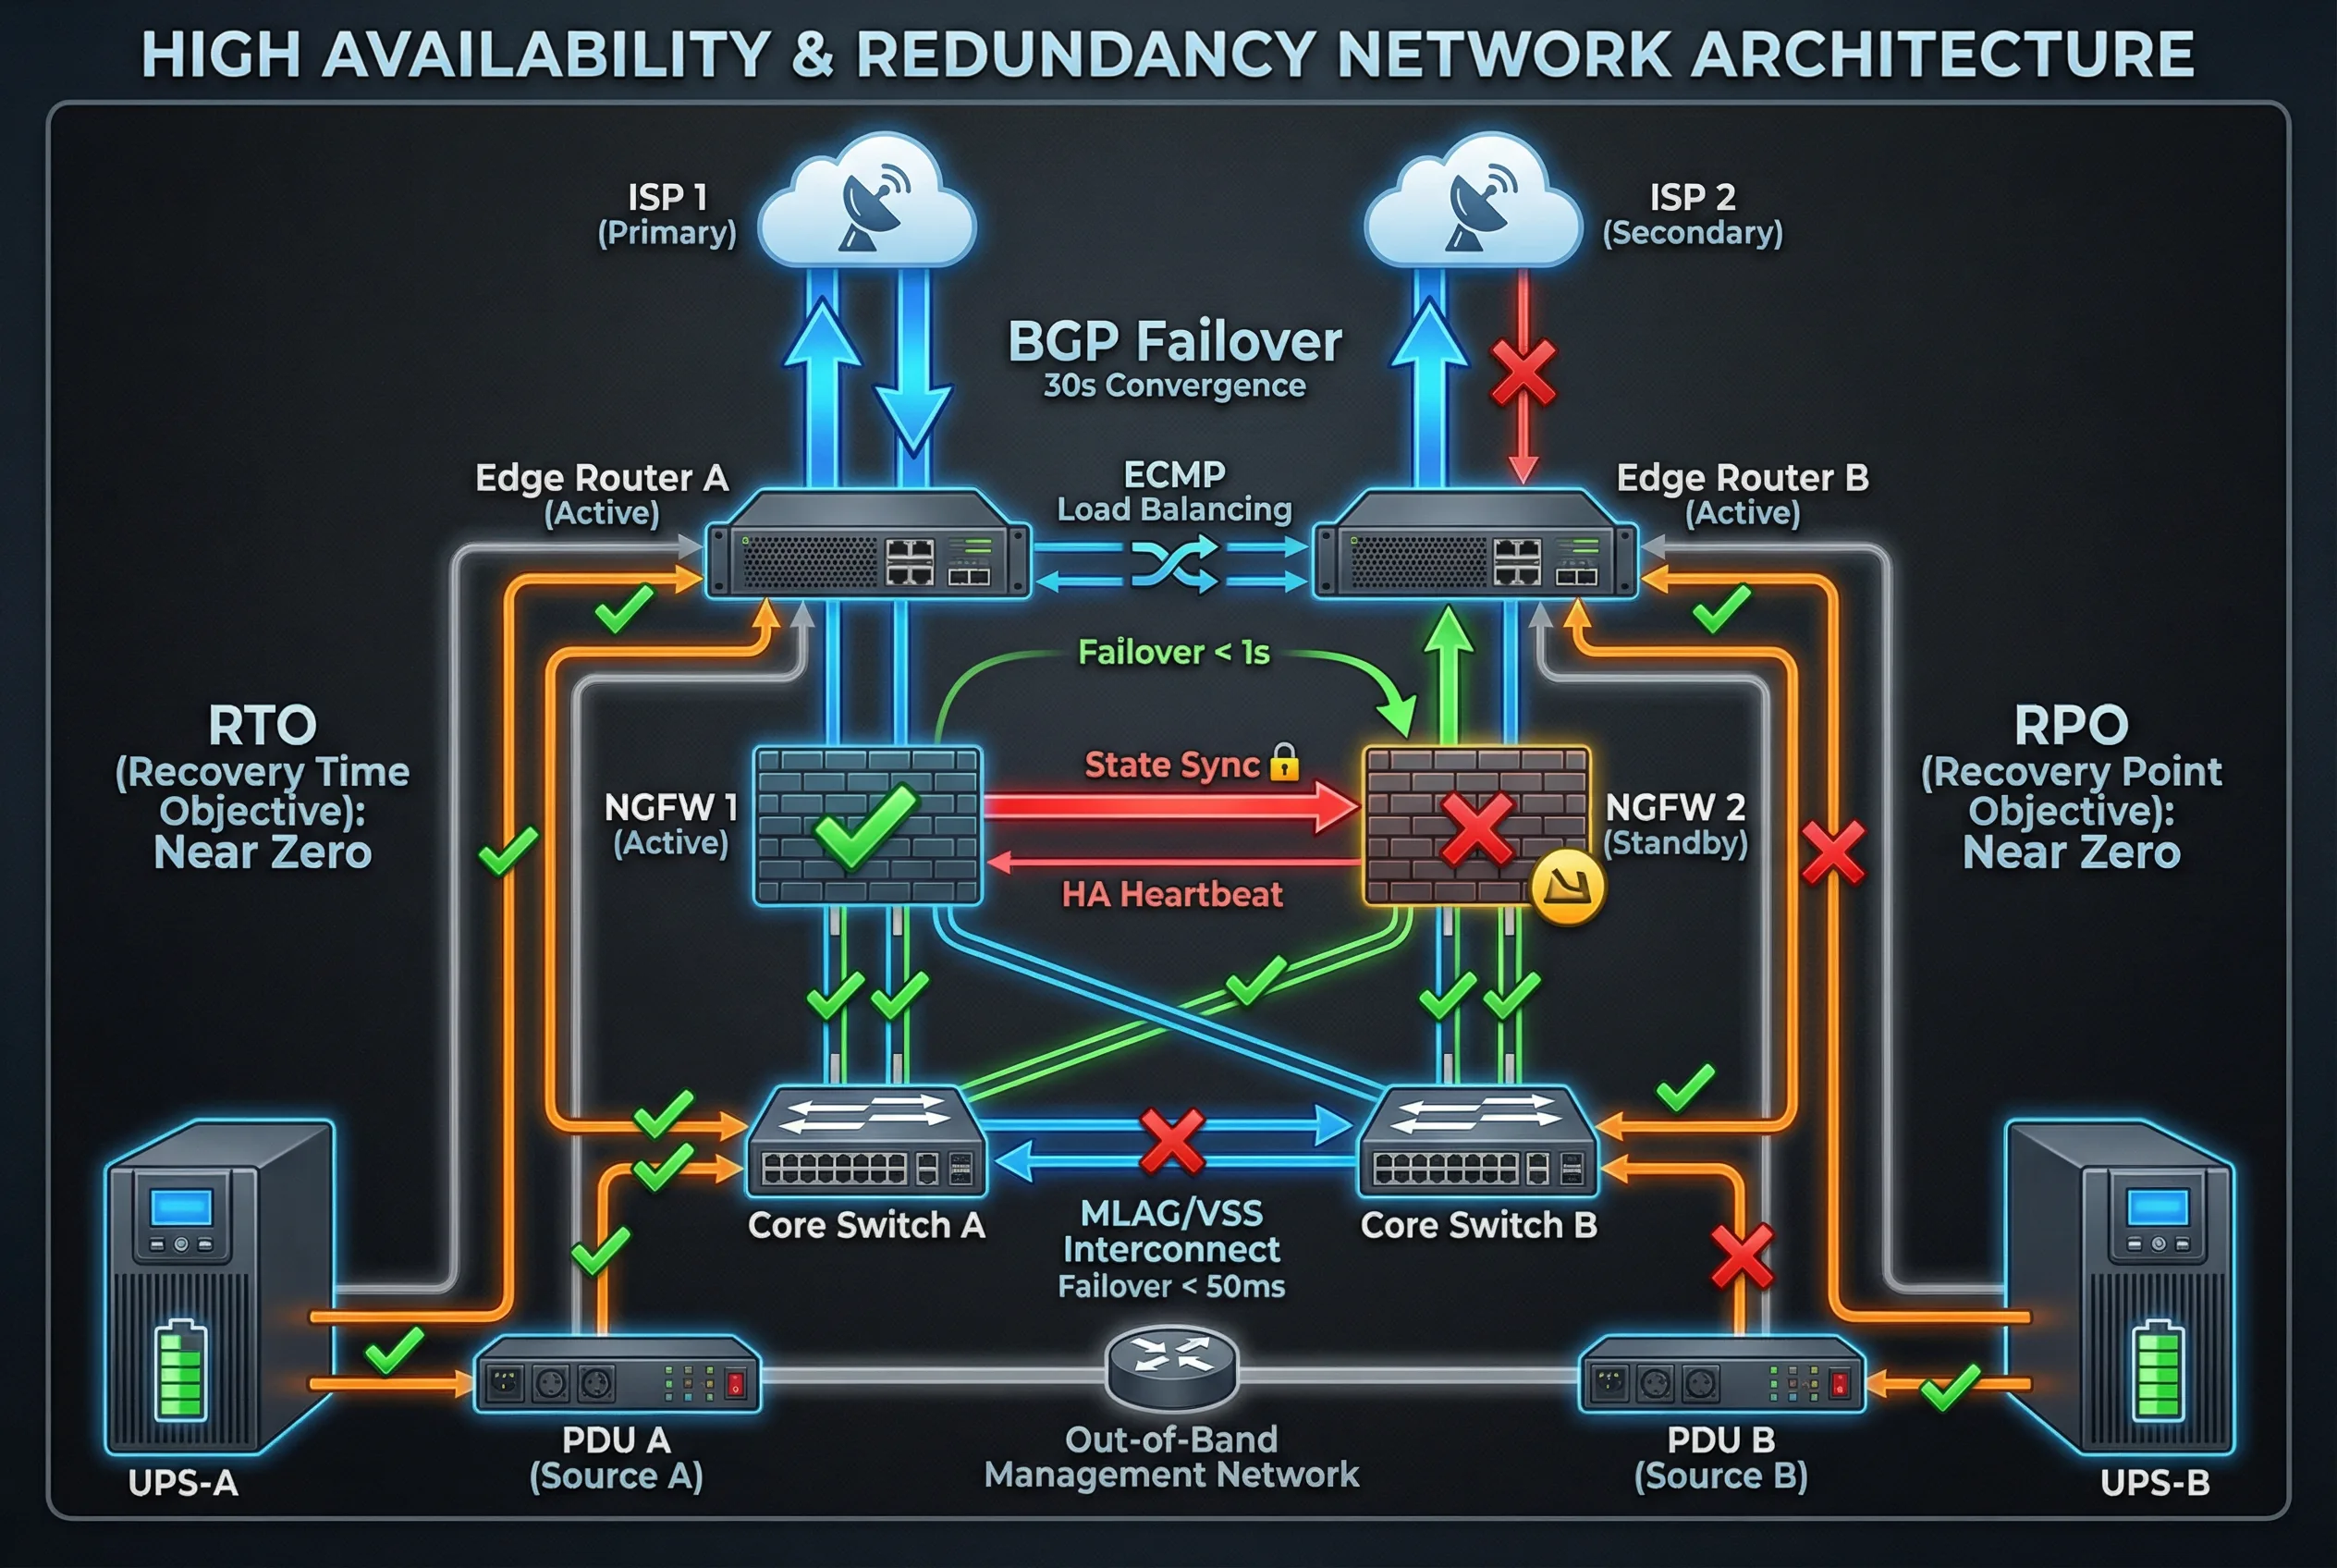
Figure 4.3: High Availability & Redundancy Architecture — Dual ISP with BGP failover, NGFW Active/Standby with state sync, MLAG core switches, and dual UPS/PDU power paths with RTO/RPO targets
Redundancy Strategy
- Cross-connect routers to both firewalls: Router A and Router B each connect to both FW-01 and FW-02, eliminating any single-link failure that would isolate a firewall from ISP connectivity.
- Use LACP/MLAG for inside and DMZ uplinks: All connections from firewalls to core switches and DMZ switches use link aggregation for bandwidth and redundancy.
- Dedicated HA links separate from data: HA heartbeat and state synchronization links use physically separate interfaces and cables from data plane interfaces to prevent HA failures caused by data plane congestion.
- Dual power paths: Each device connects PSU-A to PDU-A and PSU-B to PDU-B, which are fed from separate UPS units and ideally separate electrical circuits.
4.4 Business Logic and Exception Handling
The boundary security system processes traffic through a defined data flow and control flow. Understanding these flows is essential for troubleshooting, capacity planning, and designing SOAR playbooks. The exception handling procedures define how the system responds to three common failure scenarios that affect availability and security posture.
Data and Control Flows
- Data flow: Classify traffic by source/destination zone → enforce L7 policy (app-ID, user-ID, IPS, URL) → log decision with full 5-tuple → forward to next hop or drop.
- Control flow: SIEM correlates events across boundary, identity, and endpoint signals → SOAR triggers playbook with human approval gate → push temporary block rules, disable compromised user account, or open incident ticket.
- Switchover: Health check fails on active NGFW → standby takes over within target RTO → routing adjacencies remain consistent → sessions preserved if state sync was active at time of failure.